Providing Community Industry Insights Through Dashboards


Be sure to check out Mantis Research’s website, here!
Client: Mantis Research
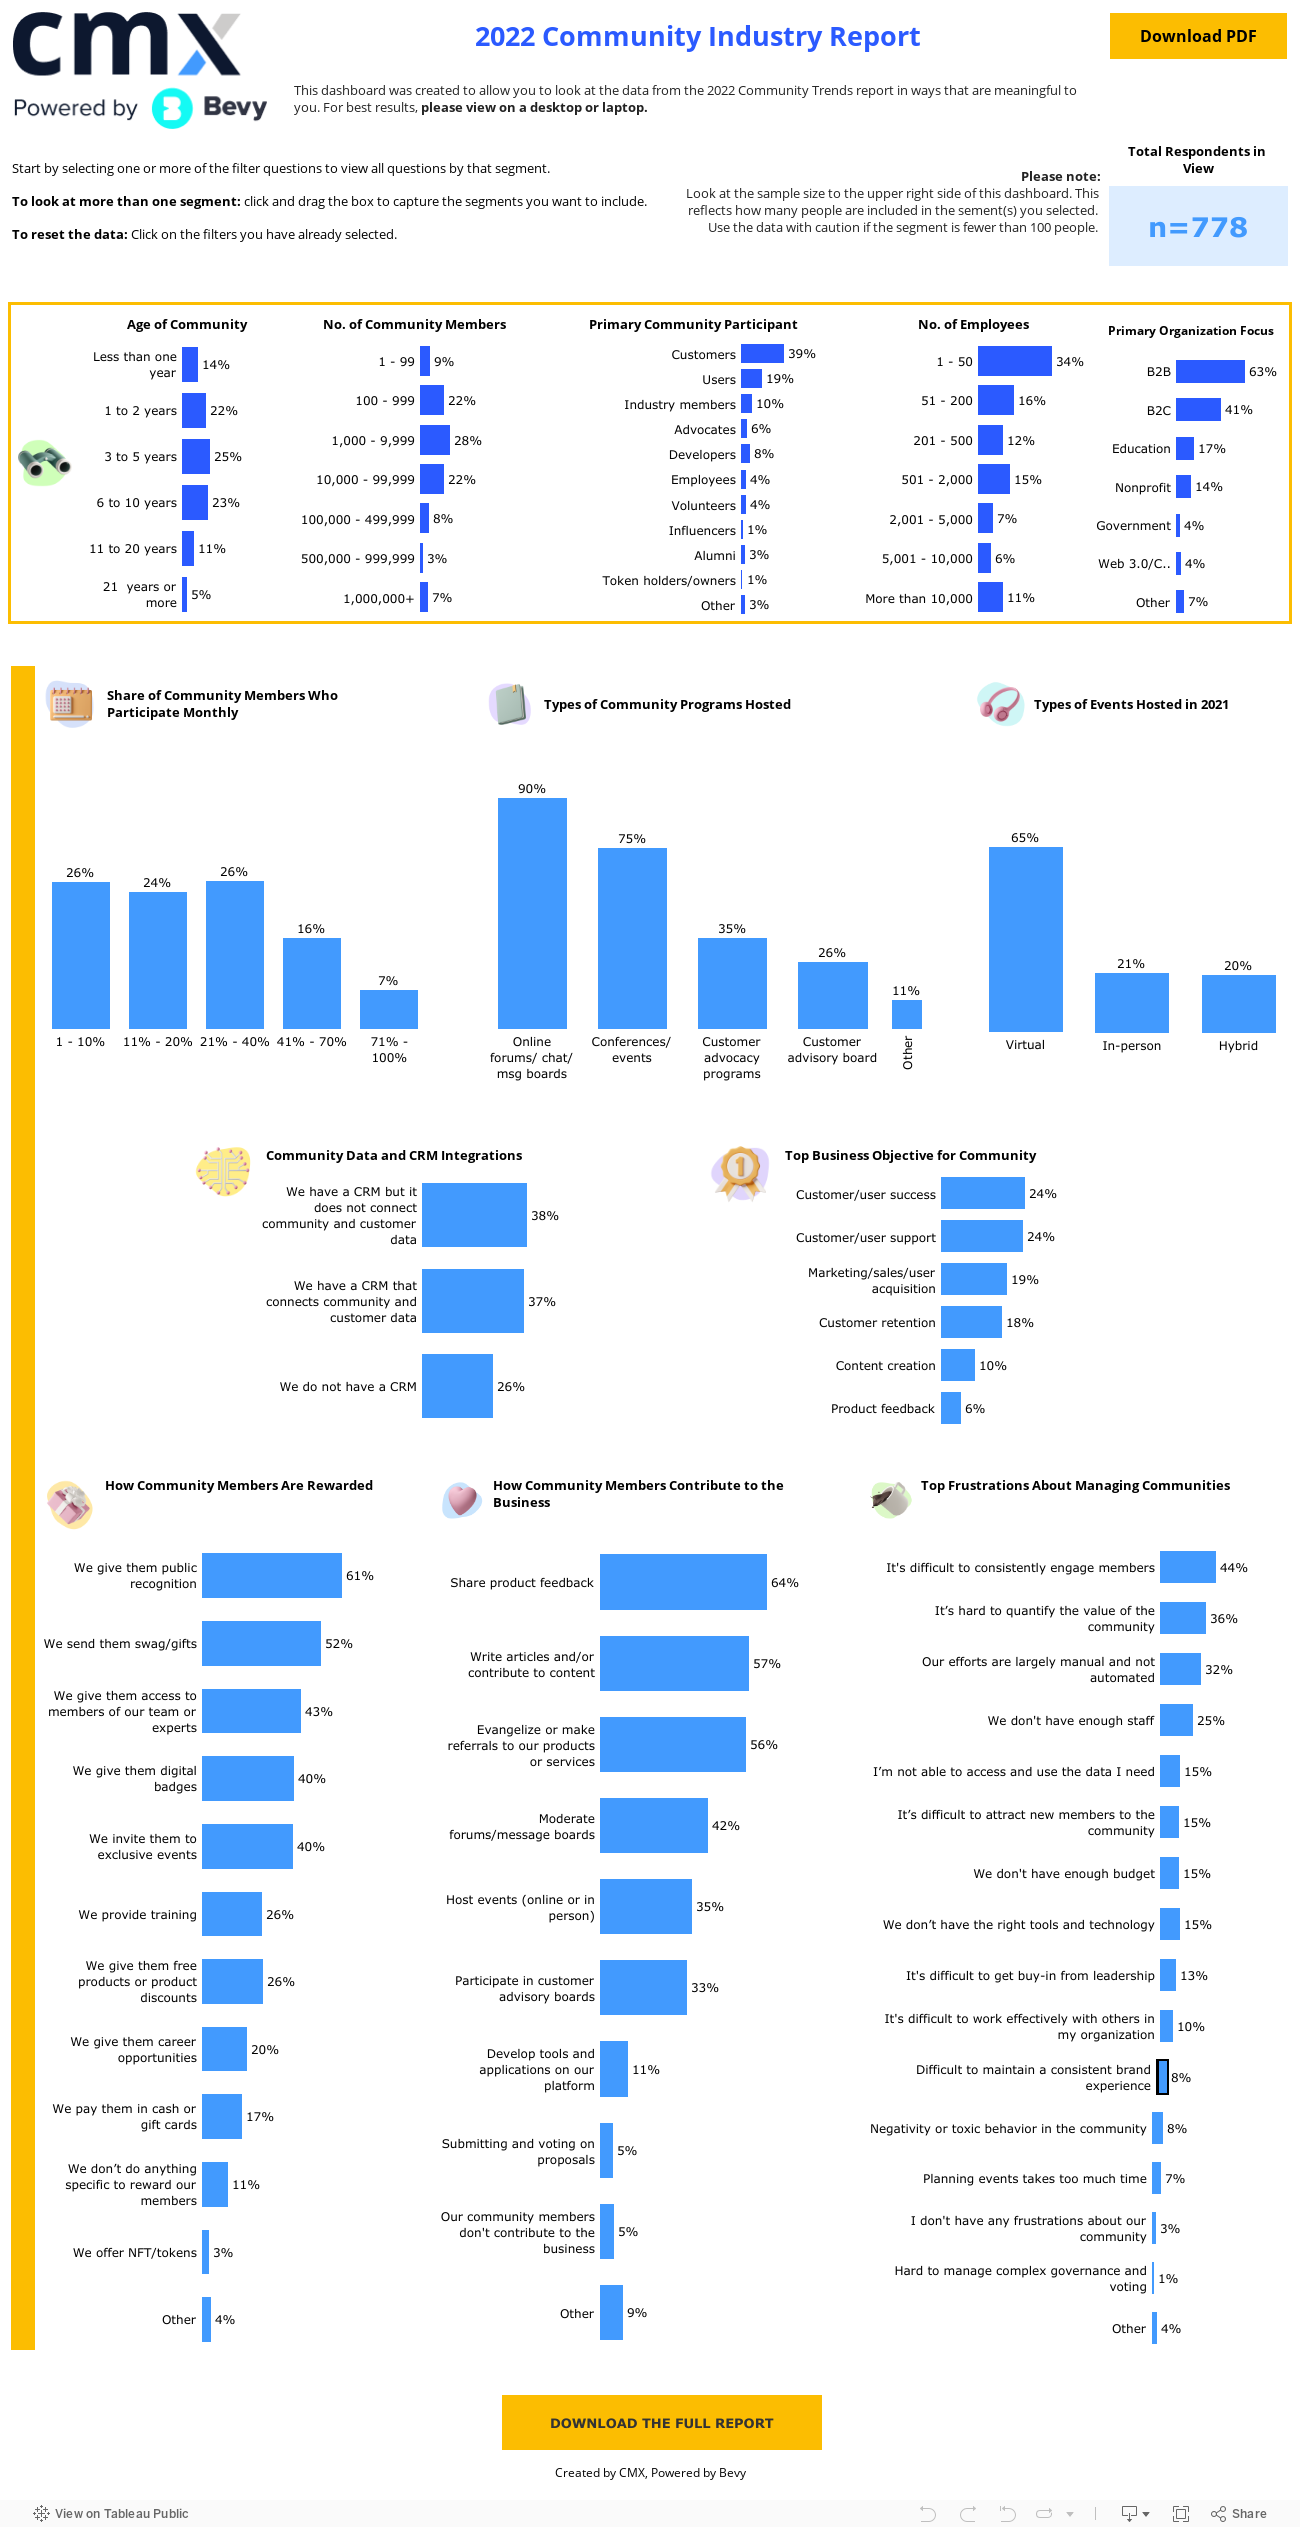
Project Title: 2022 Community Industy Report Interactive Dashboard
Background
Mantis Research is a survey-based research firm that specializes in delivering survey reports as marketing content for their clients. Their client, CMX by Bevy, partnered with Mantis to conduct an original market research study of Community Managers around the world at the beginning of 2022. Up next, both parties wanted a unique form of content to deliver the results to their audience.
The Problem
Mantis Research wanted to create an interactive dashboard based on the results of the survey for CMX. Dashboards were deemed interactive content that added to click-rate, time-on-page and overall engagement, and were also thought to be uniquely distinct for other legacy forms of market research content reporting. Unfortunately, neither team had the appropriate bandwidth nor tech stack to make this dashboard thinking a reality.
That’s when S2 was called.
Methodology
S2 developed a quantitative survey dashboard in the Tableau software. Tableau was selected for its ability to provide custom crosstab filtering via data visualization; its ability to match brand colors, fonts, and logos and provide full design control capabilities; and its ability to provide embeddable code, allowing for the dashboard to live directly on websites.
The S2 team began by understanding the original survey used in this project, and developing a coding solution to bring all of the survey’s final data into the dashboard. From there, individual charts, graphs and design elements were developed, and finally, the full dashboard was created and tested. A final embed link was provided to both Mantis and CMX to utilize.
The Result
Thanks to S2 and Tableau, the interactive survey dashboard went live on the client’s website shortly after all testing was completed. The dashboard included direct links to the printable content from the survey study, and also provided itself a robust reporting and analysis methodology that yielded significantly high engagement on the client’s website.
To learn more about this project, or to play with the dashboard yourself, be sure to scroll down.